Petroleum Geochemistry
Application of geochemical techniques to oil and gas exploration provide increased understanding of hydrocarbon generation, migration, and accumulation processes within a basin prior to drilling. As more samples become available, geochemical techniques can outline complex basin filling histories, explain unusual oil and gas distributions, and identify the sources of oil and gas. When considered against random drilling, geophysics (trap size) alone provides a forecasting efficiency of 28%, while geophysics in conjunction with geochemistry provides a forecasting efficiency of 63% for locating hydrocarbons during exploration (Sluijk and Parker, 1986).Petroleum geochemistry has proven to be an effective and inexpensive tool for reducing exploration risks.
In applying petroleum geochemistry to exploration problems, a major focus is the analysis and interpretation of the compositions of the complex hydrocarbon fluids and source rock. The composition of oil and gas is dependent on many factors, including the type of organic matter, the source maturity, the migration distance, the characteristics of the carrier bed, and post accumulation processes such as biodegradation, leakage, thermal stress and water-washing. Each of these processes establishes or alters the fluid composition in predictable ways. Fluid composition can be used to detect and characterize these processes.
Source Rock Analysis
- Screening Analysis
- Rock Eval Pyrolysis
- Organic Petrography
- Detailed Hydrocarbon Analysis (Sample Preparation)
- Detailed Hydrocarbon analysis
1. Screening Analysis
1.1 Total Organic carbon (TOC %)
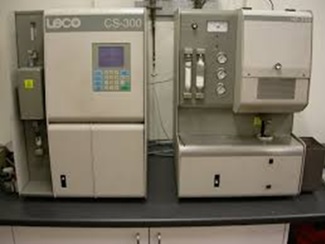
To determine the quantity of organically bound carbon, the organic molecules must be broken down to single carbon units and converted to single molecular from that can be measured quantitatively, TOC evaluation methods utilize heat and oxygen, infrared irradiation, chemical oxidants, or combinations of these oxidants to convert carbon to carbon dioxide.
Instrument used for TOC determination is LECO CS300 (Carbon Sulphur Detrminator):
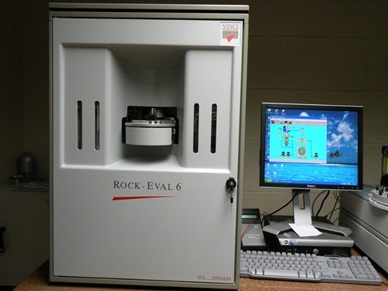
2. Rock Eval Pyrolysis
Rock Eval pyrolysis has been used for decades for oil prospecting in sedimentary basins all over the world. Rock Eval 6 has been developed for assessment for both organic and mineral carbon.
Rock Eval Pyrolysis of samples results in Pyrograms that has for peaks:
- S1:Free hydrocarbons
- S2: Remaining hydrocarbons Potential of Kerogen
- S3: CO2 produced from organic matter
Significant calculated parameters include:
- Tmax: The temperature at which maximum quantity of S2 hydrocarbons is generated
- Hydrogen Index: S2/TOC *100
- Oxygen Index= S3/TOC8100
- Genetic Potential (Petroleum Potential) = S1+S2
- Production Index= S1/S1+S2
Applications: The pyrolysis of rock samples enables to classify the type of organic matter, the thermal maturation stage and to predict the expected type of hydrocarbon (oil or gas).
3. Organic Petrography
Organic Petrography is concerned mostly with the description and classification of sedimentary organic matter. The great complexity, heterogeneity, and non-crystalline nature of sedimentary (OM) poses difficult analytical challenges to organic petrologists.
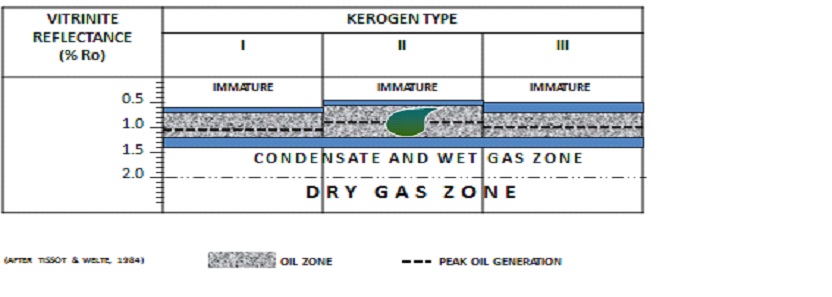
Vitrinite reflectance measurements are commonly used in petroleum exploration, coal rank determination and basin modelling. Maceral analysis is used in petroleum source rock characterization, blending of coals for coke making, and interpretation of paleo-depositional environments. Fluorescence microscopy is commonly used for the compositional evolution of lipid rich marine organic matter.
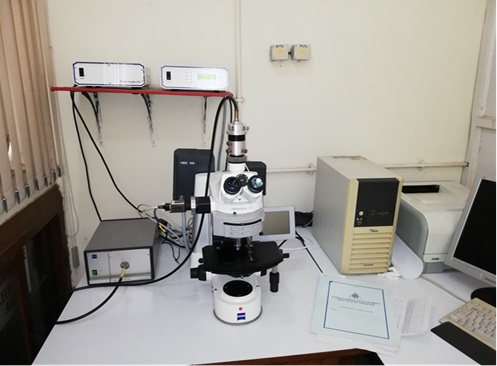
HDIP organic petrographic lab is equipped with two Zeiss microscopes; USMP-30 with photomultiplier and a recent fully automated Zeiss Z1M microscope fitted with a Spectrometer and a high resolution C-mount CMOS camera. Spectra Vision software program is used for measuring vitrinite reflectance.
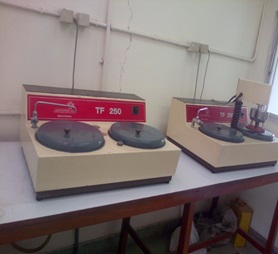
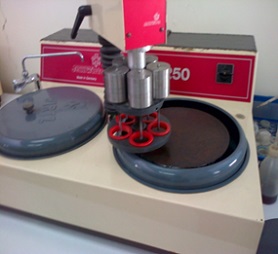
For sample preparation purpose to grind & polish the sample pellet Wirtz TG 250 machines fitted with rotating holder is used.
 |
 |
The vitrinite reflectance value used for thermal maturity assessment is made according to following guideline:
Applications: Organic Petrography is commonly used in Petroleum exploration for:
- Oil and Shale gas study
- Coal quality and rank determination
- Basin modeling
 Vitrinite |
 Inertinite |
 Inertinite |
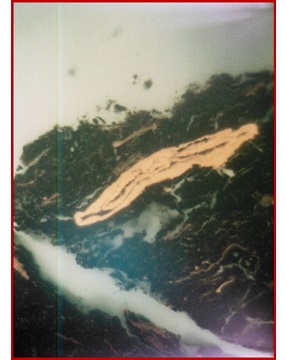 Liptinite |
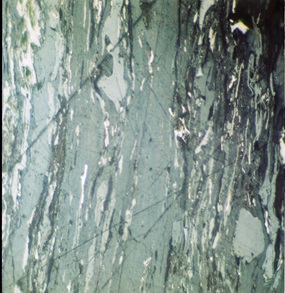
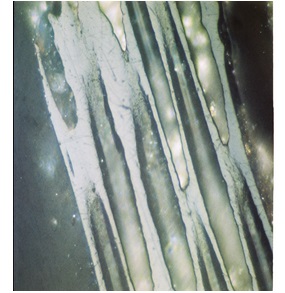
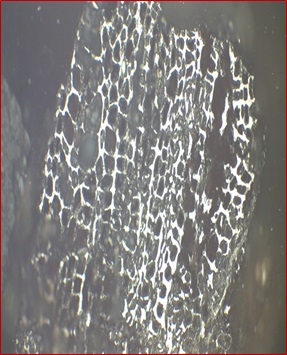
| Different type of macerals observed in sedimentary rocks of Indus Basin | |
 |
|
4. Detailed Hydrocarbon Analysis (Sample Preparation)
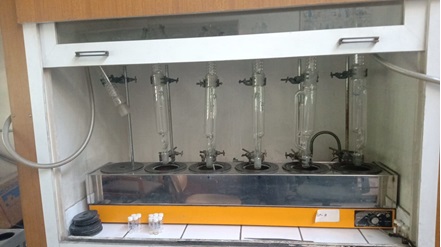
4.1 Extraction of Organic Matter (EOM) by Soxhlet Extraction
Approximately 50 grams of finely grinded sample is extracted using a mixture of dichloromethane and methanol. In soxhlet extraction the solvent is vaporized but cooled, condenses and drips down into a cellulose thimble containing the powdered sample within the Soxhlet. The hot solvent extracts the soluble organic matter.
4.2 Deasphaltation
The source rock extracts and oils are treated for removal of asphaltene using light hydrocarbon solvent where precipitated asphaltenes are separated from soluble maltene fraction by centrifugation.
4.3. Chromatographic Separation of Fractions
Liquid Column Chromatography of maltenes into three fractions: Saturated Hydrocarbons, Aromatic Hydrocarbons and Nitrogen, Oxygen and Sulphur containing compounds (NSO) is achived on activated silica-alumina column by eluting with n-hexane, dicloromethane (DCM) and ethyl acetate respectively.
5. Detailed Hydrocarbon Analysis
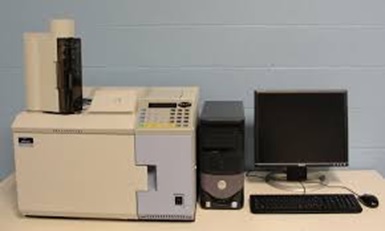
5.1 Saturated & Aromatic Hydrocarbon Analysis by GC-FID
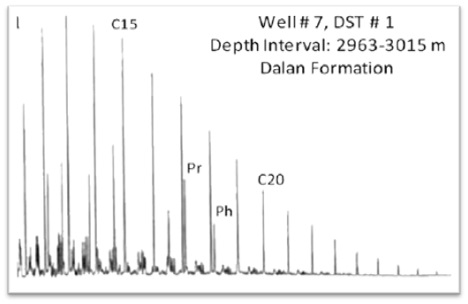
Saturated and aromatic hydrocarbon analysis is conducted by Perkin Elmer Autosystem XL Gas Chromatograph equipped with FID detector and DB-1 Column. Saturated and aromatic hydrocarbon fractions of seep/condensate/oil/extract or whole oil diluted with dichlomethane are separated into individual hydrocarbons based on molecular size on non-polar column using helium as carries gas. The column performance is monitored using mixture of nC17, nC18, pristane and Phytane.
A low-density, high-API gravity liquid hydrocarbon phase that generally occurs in association with natural gas. Its presence as a liquid phase depends on temperature and pressure conditions in the reservoir allowing condensation of liquid from vapor. The production of condensate reservoirs can be complicated because of the pressure sensitivity of some condensates: During production, there is a risk of the condensate changing from gas to liquid if the reservoir pressure drops below the dew point during production. Reservoir pressure can be maintained by fluid injection if gas production is preferable to liquid production. Gas produced in association with condensate is called wet gas. The API gravity of condensate is typically 50 degrees to 120 degrees.
The paraffin composition of condensate samples is determined by gas chromatography (GC).
5.1.1 Light Hydrocarbon Analysis
The crude oil has significant quantity of Light hydrocarbons (C4-C11) and condensate has major fraction of these molecular compounds. Organic Geochemistry has established the parameters based on these low molecular weight hydrocarbons that serve as indicators for organic facies of source rocks, extent of thermal maturity, and secondary alterations in reservoirs (Walters et al., 2003).
The C7 oil correlation star diagram (OCSD) based on plot of five ratios of light hydrocarbons is great diagnostic tools for reservoir oil correlations and to establish the genetic similarity that indicates common source rock (Halpern, 1995). These hydrocarbon compounds are resistant to alterations induced in reservoir and therefore more useful for correlation. Use of C7 OCSD is relatively easy tool for genetic correlation of reservoir oils and is successfully applied for correlation of condensates to highly maturity oils which is not possible based on biomarker correlation (Wever, 2000).
The transformations in composition of light hydrocarbons resulting from water washing, evaporation, biodegradation and migration in reservoirs is evaluated by C7 oil transformation star diagram (C7 OTSD), based on plot of eight ratios of C7 hydrocarbons (Halpern 1995). This star diagram is based upon the fact that these C7 compounds have significant difference in properties like water solubilities, boiling points and susceptibility to biodegradation, and hence useful to evaluate extent of alterations.
These star diagrams are significant to establish field fill history, reservoir compartmentalization and determination of the source of casing leakage in case of multiple reservoirs.
C7 light hydrocarbons are applied for assessment of source input, particularly ternary plot of n-C7, MCC6, and DMCC5, as n-C7 is derived from bacteria, algae, and higher plants input and serves as maturity indicator. Methyl cyclohexane is derived from humic organic matter and serves as indicator of terrestrial source whereas dimethyl cyclopentane originates form steroids and terpenoids derived from aquatic organisms, and indicates oil-associated gases (Chung et al., 1998; Whiticar et al., 1999).
Mango Parameter (1987; 1997; 2000) based on light hydrocarbons ratio (K1= (2-MH+2,3DMP)/(3-MH+2,4-DMP)) is indicator of source input, thermal maturity and biodegradation. Light hydrocarbons are used to classify the oils as paraffinic, naphthenic and aromatic using light hydrocarbon ratios. Heptane values and iso-heptane values proposed by Thompson (1979; 1983) are used for classification of oils based on maturity and source.
5.1.2 Crude Oil
Crude oil is a liquid fuel source located underground. It is extracted through drilling. Between 50% and 97% of oil is composed of hydrocarbons. Between 6% and 10% of oil is composed of nitrogen, oxygen, and sulfur. Less than 1% of oil is composed of metals such as copper, nickel, vanadium, and iron. Oil is called a fossil fuel because of its origins. It was created 400 million years ago when the remains of prehistoric algae and plankton fell to the bottom of the ocean. It combined with mud and then was covered by layers of sediment. The intense pressure heated the remains over millions of years. It first became a waxy substance called kerogen. It became liquid oil after more pressure and heat.

5.1.3 Heavy Crude Oil
Heavy crude oils are defined as any liquid petroleum with API gravity in the range of 10–22.3°. The fundamental characteristics of heavy crude oils are high viscosity and density, chemical complexity, high acidity, high sulfur, increased level of metal and heteroatom impurities, high asphaltenes content, low American Petroleum Institute (API) gravity, and low H/C ratio. Due to these unfavorable characteristics, heavy crude oils are termed low-quality crude oils, and they pose many technological challenges in their production, transportation, and processing to both the producers and the refiners. Extracting and processing of heavy crude oil require large amounts of water and energy and can potentially cause extreme damages to surrounding environment.
5.1.4 Applications
GC-FID is applied in exploration industry for reservoir characterization, connectivity of barrier structures, secondary alteration as water washing, evaporation biodegradation studies and for oil-oil correlation and crude oil transformations.
The method is applied for saturated hydrocarbon fingerprinting to establish oil-oil and oil-source correlations. GC assessment of hydrocarbon composition is used to estimate the thermal maturity, environment of deposition of source rock, level of biodegradation of hydrocarbon and thermal maturity of source as well.
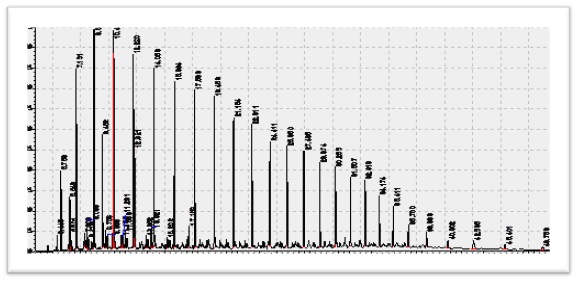
The n-alkanes are the most extensively studied group of biomarkers since they can be readily analyzed by GC-FID alone. Alkanes are derived from a variety of sources, and their carbon number distributions have been widely used to differentiate marine vs terrestrial source materials. The odd/even carbon number preference of these distributions will change systematically with maturity, and biodegradation will also change the distribution by initially removing the lower number carbon compounds preferentially over the longer chain compounds. Hedburgdescribed a notable characteristic of oils derived from terrigenous source materials as being their waxy nature resulting from the high wax content of their higher plant source materials.
The discovery of cutans in various plants has introduced another possible source of n-alkanes upon thermal breakdown of this material.n-Alkane distributions in many crude oils typically maximize in the C20-C40 range but with the advent of high-temperature GC columns, the analysis of oils, bitumens, and waxes from a variety of source materials has shown the existence of compounds extending to at least C70 and beyond. In summary, although oils from terrigenous sources are waxy, not all waxy oils are necessarily derived from terrigenous source materials (Philip et al, 1997).

- OEP29 (Odd Even Predominance)
- The composition and distribution of n-alkanes carbon numbers reflect the source of kerogenic organic matter, sedimentary environment, and maturity of the rocks.
In comparison to the large published works regarding the assessment of potential sources of hydrocarbons in marine sediments, n-alkane distributions with odd number preferences (C27, C29, C31) and/or (C15, C17, C19) or with no carbon number preferences, relating, respectively, to vascular plants, marine animals and anthropogenic origin, have been frequently reported (Benlahcen et al. 1997; Baumard et al. 1999; Gogou et al. 2000; Louati et al. 2001; Tsapakis et al. 2003; De Luca et al. 2004; Gogou and Stephanou 2004; Zaghden et al. 2005; Mille et al. 2007; Zrafi-Nouira et al. 2008). However, distribution of n-alkanes with even carbon number preferences has been much less reported (Nishimura and baker 1986; Grimalt and Albaige´s 1985, 1986, 1987; Debyser et al. 1977; Mille et al. 1992, 2007) (FatmaAloulou, MonemKallel, Mohamed Dammak, BoubakerElleuch, Alain Saliot)
OEP29 = (C27 + 6C29 + C31)/(4C28 + 4C30)
The characteristics of odd/even carbon number predominance in n-alkane compounds are effective for oil–source rock correlation. - TAR (terrigenous/aquatic ratios)
- The TAR, which is the ratio between the concentrations of short-chain to long-chain n-alkanes, can be used to evaluate the importance of terrigenous inputs in comparison to aquatic ones.
TAR = (nC27 + nC29 + nC31)/(nC15 + nC17 + nC19) - CPI (Carbon preference Index)
- The CPI has been frequently used as a source indicator of n-alkanes in marine sediments (Farrington and Tripp 1977; Boehm and Requejo 1986; Colombo et al. 1989; Prahl et al. 1994). It represents the relative abundance of odd-numbered linear alkanes versus even-numbered linear alkanes (Bray and Evans 1961). N-alkanes derived from terrestrial vascular plant usually have CPI values ranging from 3 to 6, while petrogenic hydrocarbons show CPI values close to 1. Lower CPI indicates microbial sources of hydrocarbons (Rushdi et al. 2006).
CPI = [ (C25 – C33)odd/ (C24 – C32)even + (C25 – C33)odd/ (C26 – C34)even]/2 - UCM (Unresolved Complex Mixture)
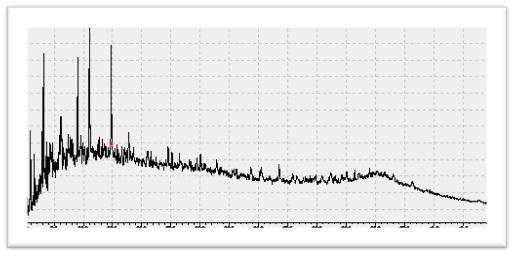
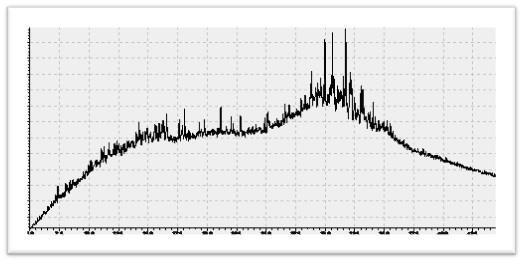
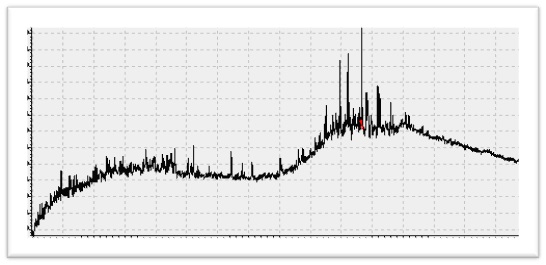
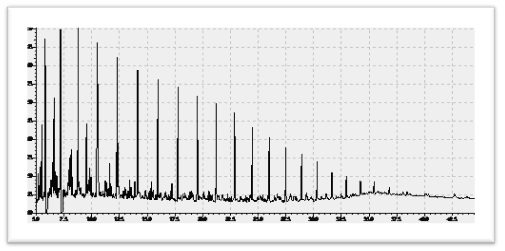
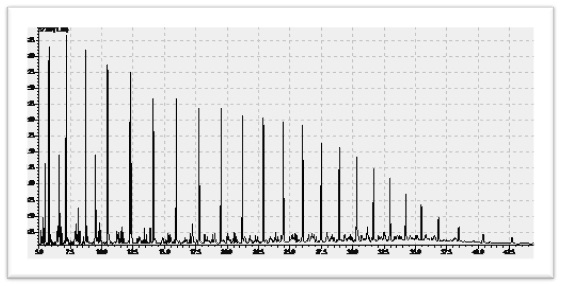
- A complex hump, is a feature frequently observed in gas chromatographic (GC) data of crude oils and extracts from organisms exposed to oil. The reason for the UCM hump appearance is that GC cannot resolve and identify a significant part of the hydrocarbons in crude oils. These hydrocarbons are derived mainly from oil spills and/or fossil fuel utilization. Biogenic hydrocarbons derived from higher plants (FatmaAloulou, MonemKallel, Mohamed Dammak, BoubakerElleuch, Alain Saliot).
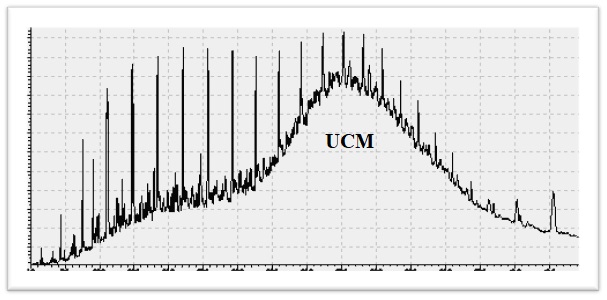
Gas Chromatogram of Dhurnal-5 with UCM - Pristan/Phytane Ratio (Pr/Ph)
- The ratio of the saturated isoprenoids pristane/phytane are potential indicators of the redox conditions during sedimentation and diagenesis. Very low Pr/Ph ratios are associated with lithofacies that were deposited in hypersaline environments. Increases in the Pr/Ph ratio within individual traverses are interpreted as indicating increasing oxidation of organic matter during deposition and early diagenesis.
Pr/Ph < 1 reducing/Anoxic depositional Environment
Pr/Ph > 1 Oxic depositional Environment
5.2 Biomarker Analysis by GCMS
As petroleum is derived from the organic carbon of once living organisms, these resources are correctly termed fossil fuels.
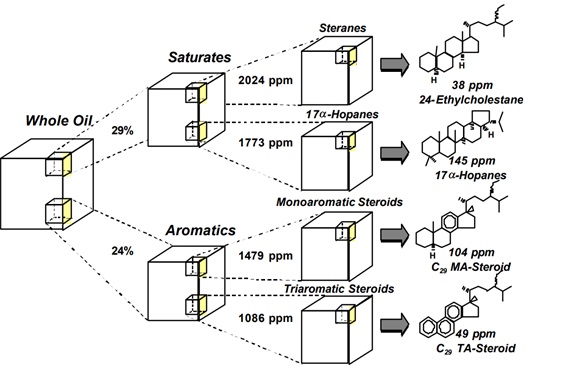
Saturated and aromatic biomarkers are analyzed routinely by GC-MS, either on whole oils, or more commonly, on hydrocarbon fractions. The separation of individual isomers, including epimers, using modern capillary columns with nonpolar stationary phases is sufficient to resolve many of the biomarkers of interest. A mass spectrometer is used for detection, providing a molecular "fingerprints" that identify the eluting compounds. Electron impact (typically 70 ev) is the most commonly used ionization technique. Under these conditions, most biomarkers yield ion fragments that are characteristic of their class

Few biological molecules escape substantial alteration and rearrangement during the conversion from biomass to kerogen to oil. Proteins, sugars, nucleic acids, and most biomolecules are degraded rapidly by microbes and chemical processes. Lipids, waxes, and polymeric material in cell walls and membranes tend to be more resistive and may survive relatively intact through diagenesis. These compounds become incorporated into the kerogen matrix and lose functional groups. When thermally cleaved and expelled in oil, some of these compounds retain enough of their original carbon skeleton to identified their biological precursors. These molecules are termed biomarker compounds, or biomarkers for short. (C. S. Hsu1, C.C. Walter, G. H. Isaksen , M. E. Schaps , and K.E. Peters, 2003).
- All hopanes (and most other triterpanes and diterpanes) yield a characteristic ion with a m/z (mass-to-charge) of 191.
- Steranes yield characteristic ions with m/z of 217 and 218.
- Triaormatic appears at m/z 231, Phenathrenes at m/z 198 and methhlyPhenathrene at m/z178
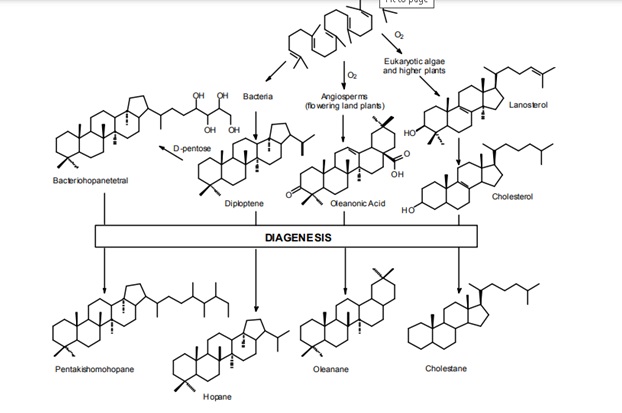
The product-precursor relationship is the foundation of biomarker applications in geochemistry.Figure.26. illustrates biosynthesis of several biological compounds from a common precursor: squalene, a C30 isoprenoid. Using reactions that do not require the presence of oxygen, bacterial cyclize squalene into diploptene. This pentacyclictriterpanoid can be further modified to produce wide array of biochemicals. For example, with the addition of Dpentose, diploptene is converted to C35bacteriohopanetetral. Eukaryotic organisms use oxygen and synthesize tetracyclic steroids instead of triterpanoids. Lanosterol is a precursor to many common sterols, but numerous other modifications to the basic structure occur in nature. Both bacterial hopanols and eukaryotic sterols are used primarily to modify the properties of cellular membranes. Higher land plants are particular adept in the synthesis of unique biochemicals from a squalene precursor. These are used for a wide array of functions ranging from growth hormones to defenses against insects and fungi. All functional groups are lost when these compounds are buried and undergo diagenesis; however the carbon skeleton is preserved and the relationship between the biological precursor and the geological product is evident.
5.2.1 Applications
- Steranes and Hopanes
- Strenaes are algea originated biomarker and hopane is bacterial Steranes and triterpanes are ubiquitous in most oils and rock extracts. Some of these are diagnostic for specific biota. Dinosteranes are produced by dinoflagellates, n-propylcholestane indicates input from chrysophyte marine algae, and gammacerane is thought to be derived from tetrahymanol, a triterpanoid that is produced by anaerobic green-sulfur bacteria and found in ciliates that consume such organisms. Much of the information gleaned from steranes and triterpanes arise not from the occurrence but from their relative distribution. For example, the ratio of hopanes-to-steranes can serve as an indicator of source facies.9 Low ratios were found in marine sources, while high ratios were observed for lacustrine and terrigenous sources, shown in following figure:
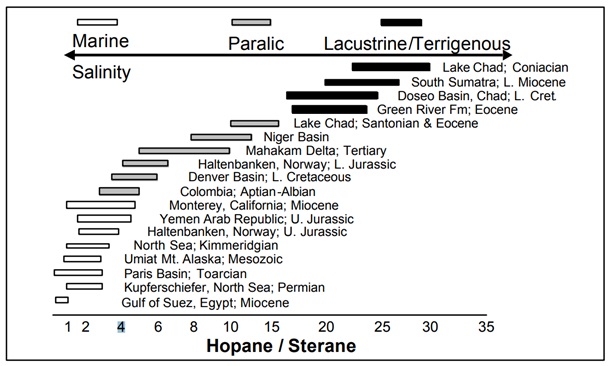
Correlation of source facies with the total hopane/sterane ratio (C. S. Hsu, C.C. Walters, G. H. Isaksen, M. E. Schaps , and K.E. Peters) - Age Diagnostic Biomarkers
- Most petroleum biomarkers are produced from biochemicals that follow ancient synthetic pathways. Steranes and hopanes have been identified in Precambrian rocks ~2.7 billion years old.10 Some biochemical evolved with new biota the arose in the Phanaerozoic and can be used as age-diagnostic biomarkers. For examples, norcholestanes are derived from diatoms and their relative abundance in marine oils increases slowly in the Cretaceous and rapidly in the Tertiary.11 Similarly, oleananes are derived from Angiosperm land plants. Although these flowering plants evolved in the early Mesozoic, they become the dominant land plants only in the Late Cretaceous. Oils with high oleanane concentrations are identified as relatively young and derived from source rocks that received a high proportion of land plant debris
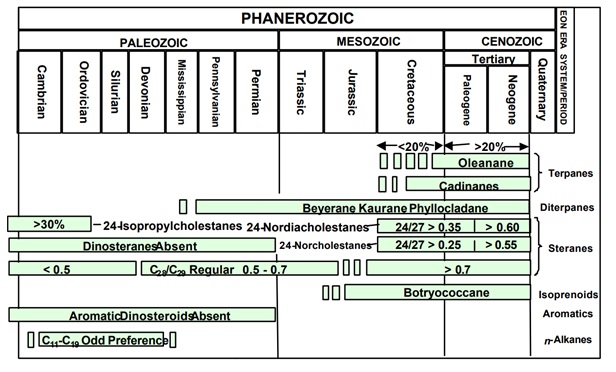
Age Diagnostic Biomarkers (C. S. Hsu, C.C. Walters, G. H. Isaksen, M. E. Schaps , and K.E. Peters) - Depositional Environment
-
- Pr/Ph, Pristane/nC17 and Phytane/nC18 ratios give information about the depositional environment, biodegration and origin of organic matter as shown in following figure:
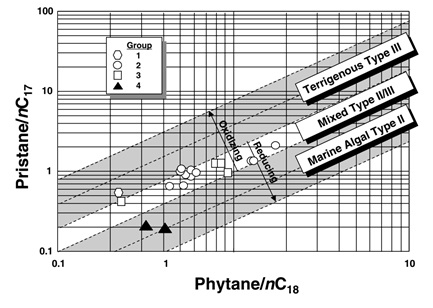
Plot Pristane/nC17 vsPhytane/nC18 (Peters, K. E., 2005) - Regular Steranes C27%, C28% and C29% also give indication about the depositional environment as shown in the following figure:
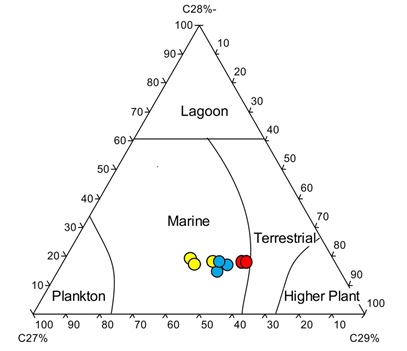
Ternary diagram of C29%, C28%, C27% regular steranes showing marine depositional environment of studied wells
- Pr/Ph, Pristane/nC17 and Phytane/nC18 ratios give information about the depositional environment, biodegration and origin of organic matter as shown in following figure:
- Oil to Source rock correlation
- GCMS is actually the biomarker/fingerprinting of crude oil and source rock through which their correlation can be studied which is very helpful information for the E&P industry before exploration and reservoir studies.
- Oil to Oil source rock correlation
- GCMS is actually the biomarker/fingerprinting of crude oilsof any study area through which their correlation can be studied which is very helpful information for the E&P industry before exploration and reservoir studies.
- Multiple Charge History
5.3 Aromatic Hydrocarbons by GCMS
5.4 Diamondoid Analysis by GCMS
5.5 Seep Analysis
Oil and gas seeps represent the surface escapes of subsurface hydrocarbon accumulation, and thus, the presence of oil and gas seeps provides indirect information on deeper subsurface deposits of hydrocarbons that can potentially aid exploration. As refinement of exploration models yields economic benefits, oil and gas seeps globally have been the subject of in-depth studies (J. B. Duan et al, 2016).